A couple of standard tools for debugging and tuning graphics applications found to be useful on Silicon Graphics machines are GLdebug and GLprof, described in detail in [GLPTT92]. GLdebug is a tracing tool that allows you to trace the graphics calls of an application. This is quite useful because most performance bugs, such as sending down redundant normals or drawing things twice, have no obvious visual cue. The tool can also generate C code that can be used (with some massaging) to write a benchmark for the scene. GLprof is a graphics execution proffer that collects statistics for a scene and can also simulate the graphics pipeline and display pipeline bottlenecks (host, transform, geometry, scan-conversion, and fill) over the course of a frame. The GLprof statistics include counts for triangles in different modes, mode changes, matrix transformations, and also the number of polygons of different sizes in different fill modes.
Some of the tools in the standard UNIX environment are also very useful. prof, a general profiler which does run-time sampling of program execution, allows you to find hot spots of execution.
Silicon Graphics provides some additional tools to help with system and real-time tuning. pixie is an extension to prof and does basic block counting and supports simulation of different target CPUs. par is a useful system tool that allows you to trace system and scheduling activity. Silicon Graphics machines also have a general system monitoring tool, osview, that allows you to externally monitor detailed system activity, including CPU load, CPU time spent in user code, interrupts, and the OS, virtual memory operations, graphics system operations, system calls, network activity, and more.
For more detailed performance monitoring of individual applications, Silicon Graphics provides a product called WorkShop that is part of the CASEVisionTM tools which is a full environment for sophisticated multiprocess debugging or tuning[CASE94]. For monitoring of real-time performance of multiprocessed applications, there is the WindViewTM for IRIX product based on the WindViewTM product from WindRiver. WindView works with IRIX REACT to monitor use of synchronization primitives, context switching, waiting on system resources, and tracks user-defined events with time-stamps. The results are displayed in a clear graphical form. Additionally, there is the Performance Co-PilotTM product from Silicon Graphics that can be used for full-system real-time performance analysis and tuning.
The most valuable tools may be the ones you write yourself as it is terribly difficult for outside tools to non-invasively evaluate a real-time application. Real-time diagnostics built into the application are useful for debugging, tuning, and even load-management. There are four main types of statistics: system statistics, process timing statistics, statistics on traversal operations, and statistics on frame geometry.
System statistics include host processor load, graphics utilization, time spent in system code, virtual memory operations, etc. The operating system should allow you to enable monitoring and periodic querying of these types of statistics.
Process time-stamps are taken by the processes themselves at the start and end of important operations. It is tremendously useful to keep time-stamps over several frames and then display the results as timing bars relative to frame boundaries. This allows one to monitor the timing behavior of different processes in real-time as the system runs. By examining the timing history, one can keep track of the average time each task takes for a frame, and can also detect if any task ever extends past a frame boundary. The standard deviation of task times will show the stability of the system. Process timing statistics from IRIS PerformerTM are shown in Figure 16. Geometry statistics can keep track of the number of polygons in a frame, the ratio of polygons to leaf nodes in the database, frequency of mode changes, and average triangle mesh lengths. IRIS PerformerTM displays a histogram of tmesh lengths, shown in the statistics above in Figure 16.

FIGURE 16. Process and Database Statistics
Traversal and geometry statistics do not need to be real-time, and may actually slow traversal operations. Therefore, they should only be enabled selectively while tuning the traversals and database. Traversal statistics can keep track of the number of different types of nodes traversed, the number of different types of operations performed, and perhaps statistics on their results. The culling traversal should keep track of the number of nodes traversed vs. the number that are trivially rejected as being completely outside the viewing frustum. A high number of trivial rejections means that the database is not spatially well organized because the travsersal should not have to examine many of those nodes.
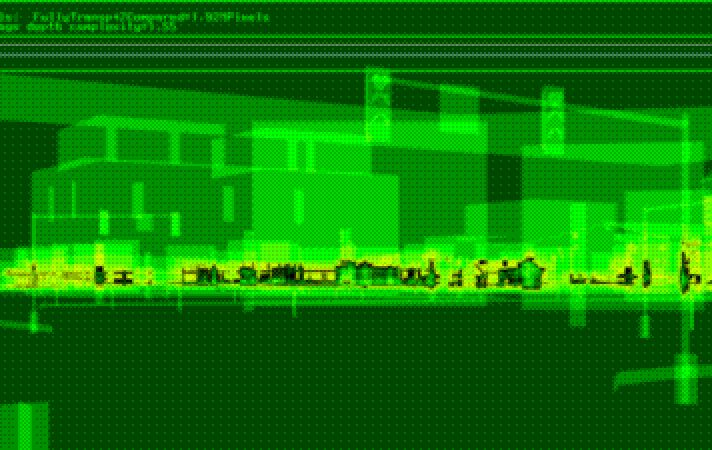
Additionally, IRIS PerformerTM supports the display of depth complexity, where the scene is painted according to how many times pixels are touched.The painted framebuffer is then read back to the host for analysis of depth complexity. This display is comfortably interactive on a VGXTM or RealityEngineTM due to special hardware support for logical operations and stenciling. Thus, you can actually drive through your database and examine depth complexity in real-time.

FIGURE 17. Pixel Depth Complexity Profile